From our sponsor: Leverage AI for dynamic, custom website builds with ease.
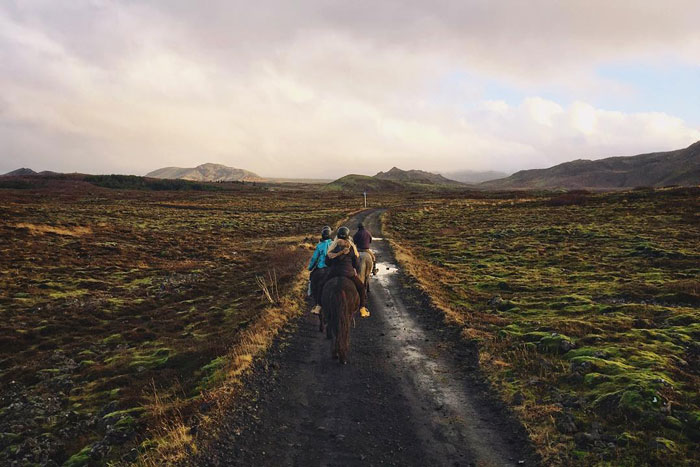
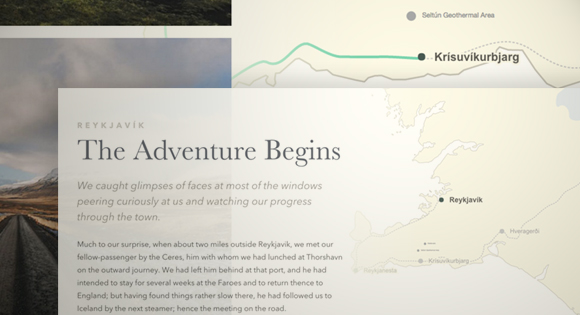
Today we’d like to share an experimental demo with you. This demo is an interactive map that will animate a map path while scrolling the page. The main idea is to connect the story being told with the path itself. The journey can also contain images that will indicate where they have been taken with a semi-transparent cone. It will appear as soon as the image is in the visible viewport. A little plane icon is used in the last bit of the path in order to indicate that the journey was made on an aircraft.
- ChromeSupported
- FirefoxSupported
- Internet ExplorerNot supported
- SafariSupported
- OperaSupported
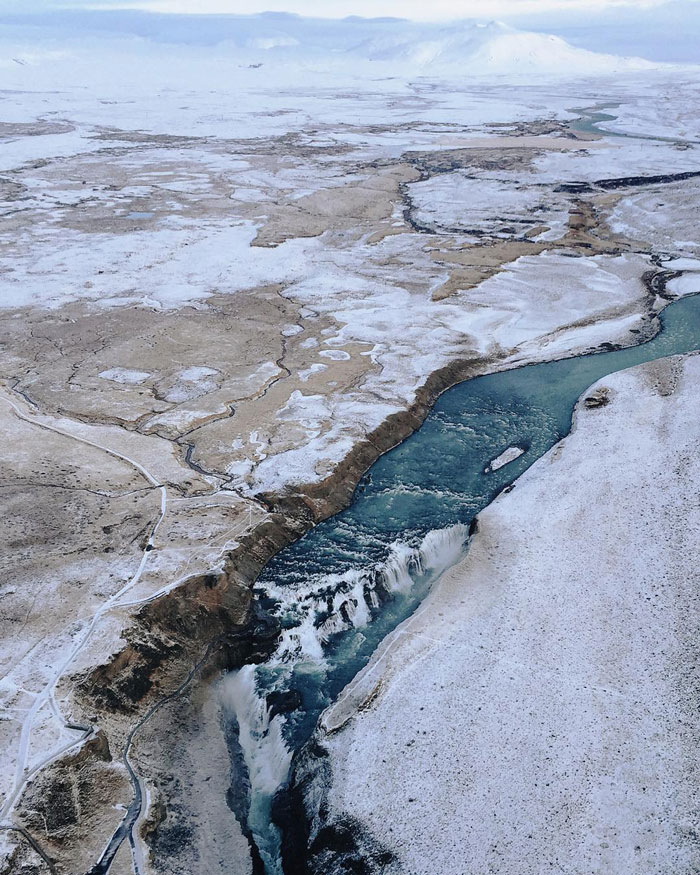
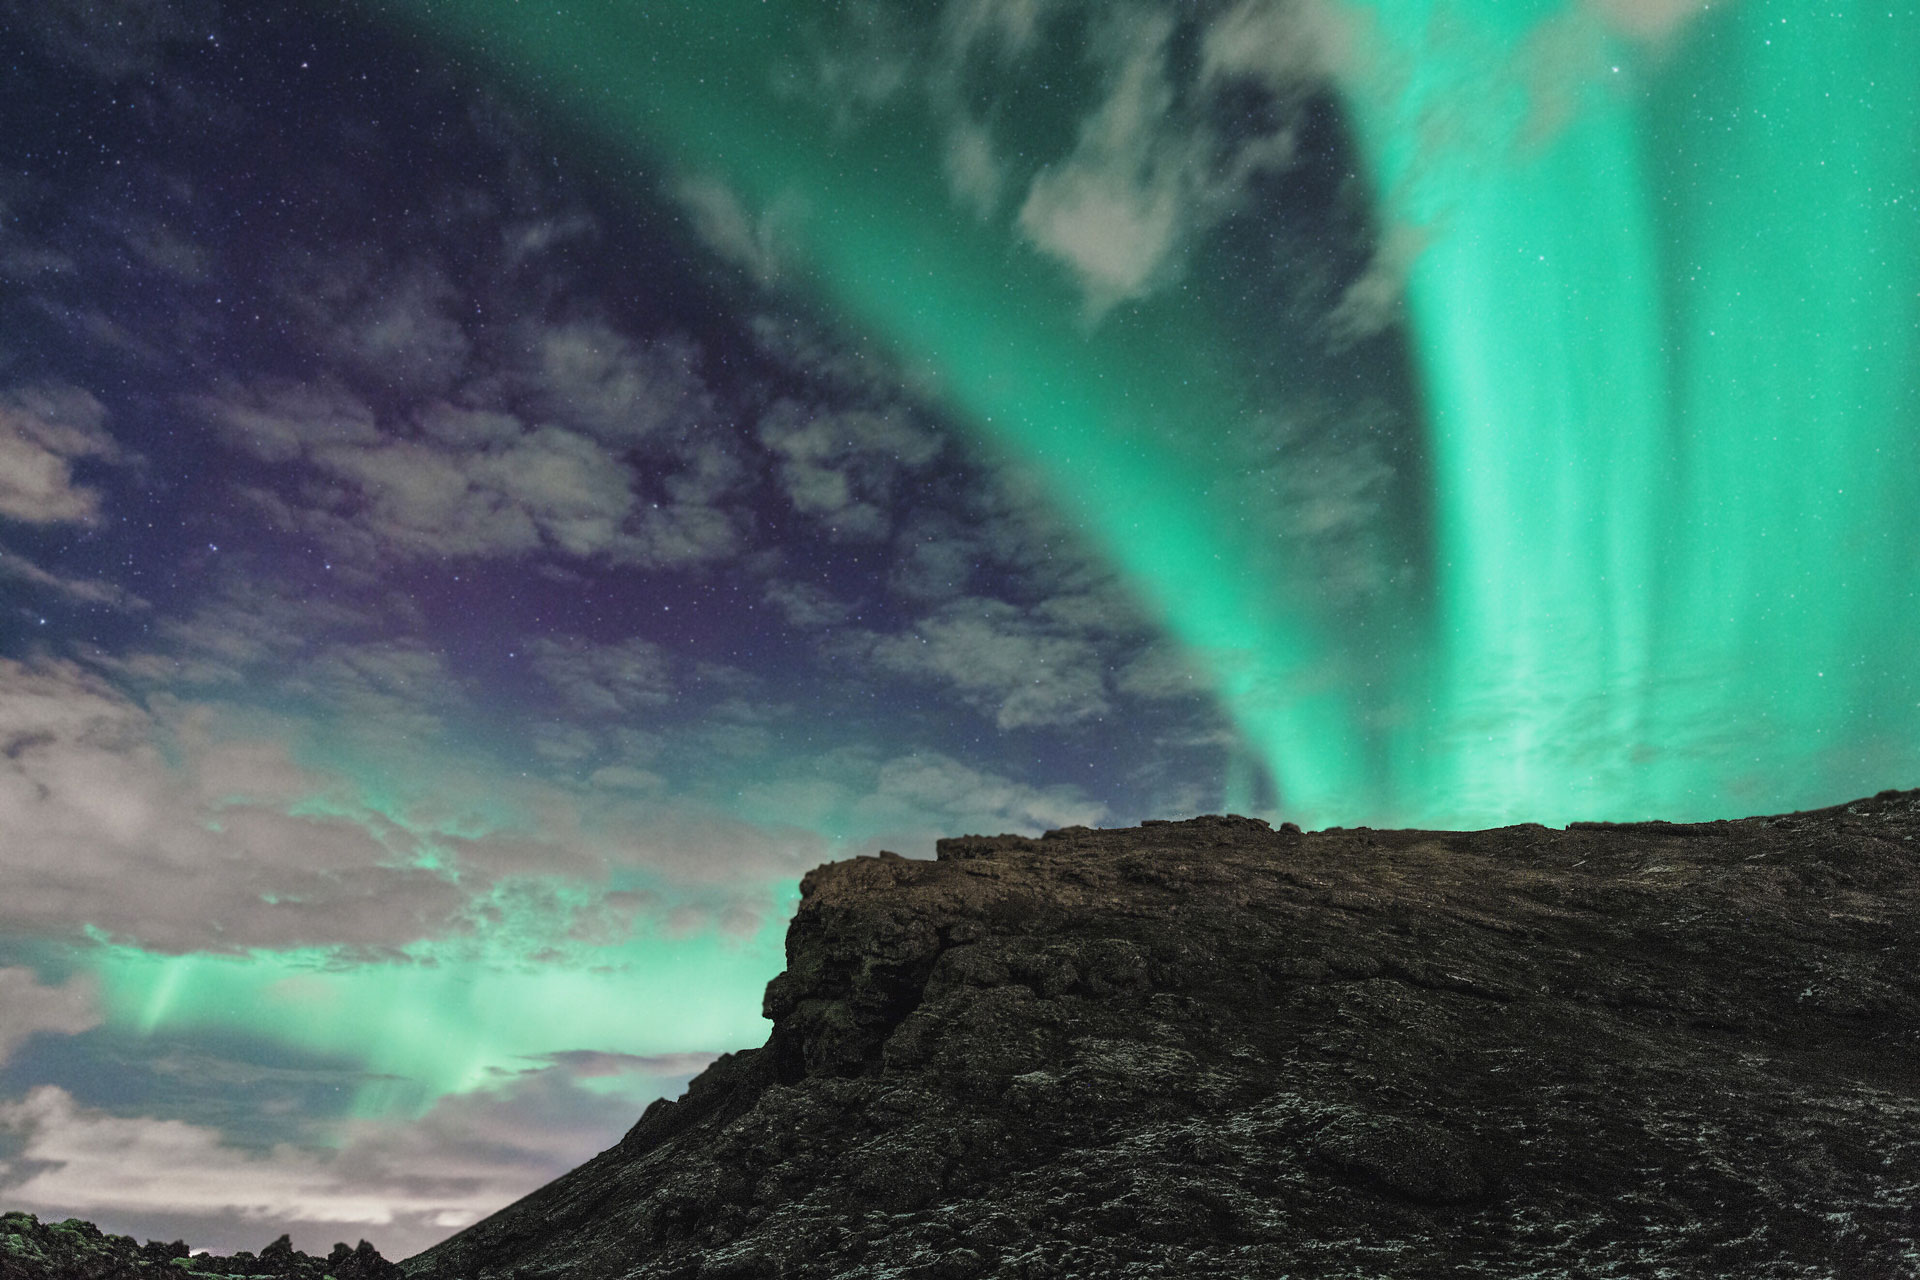
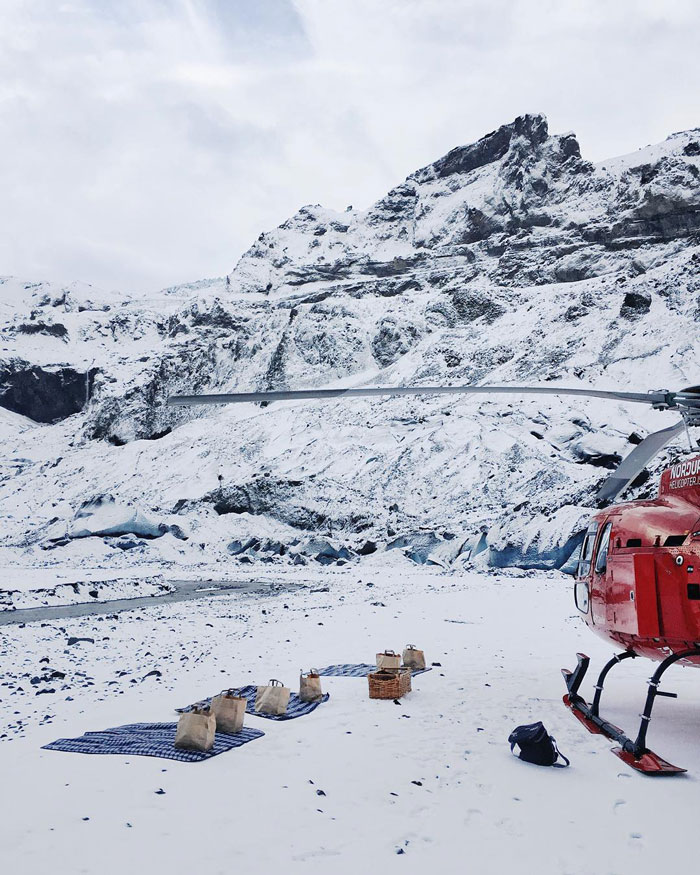
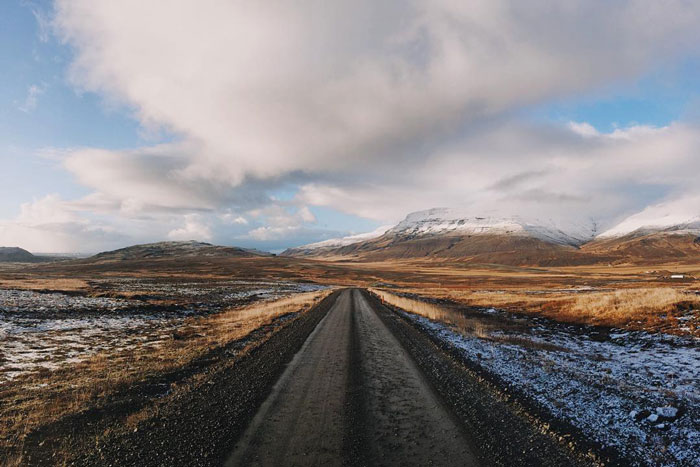
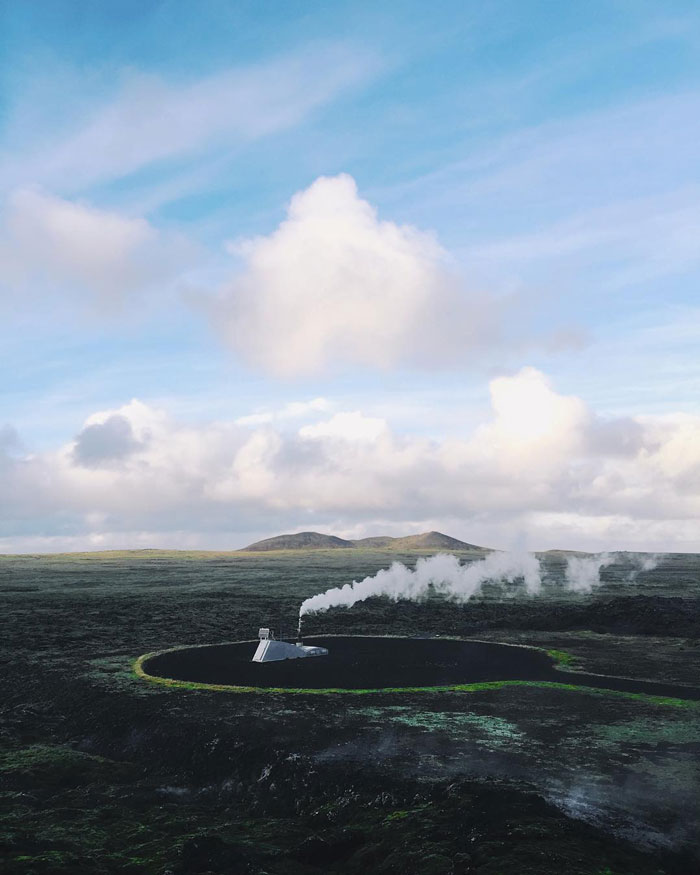
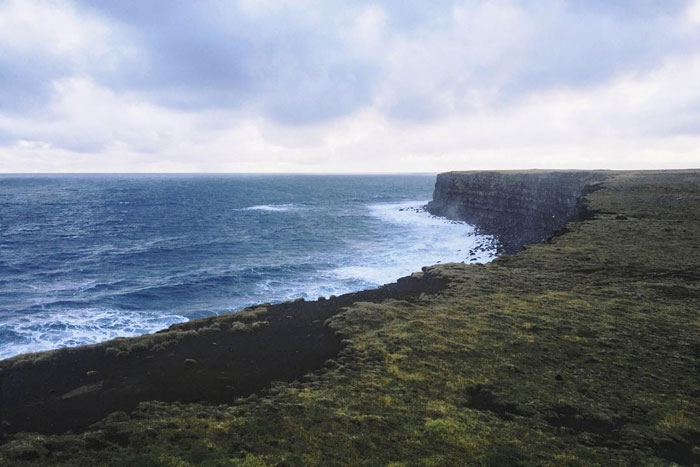
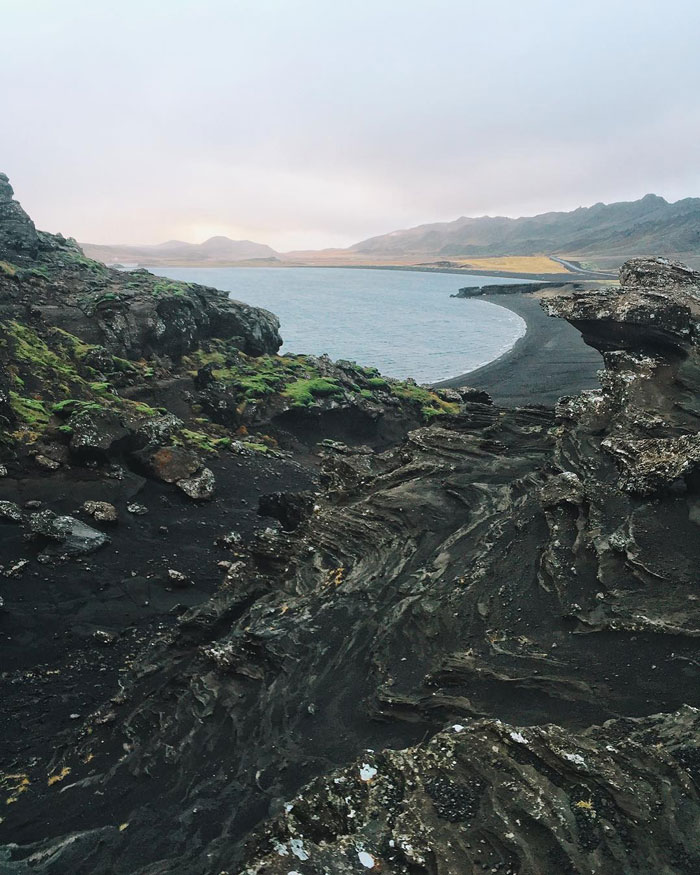
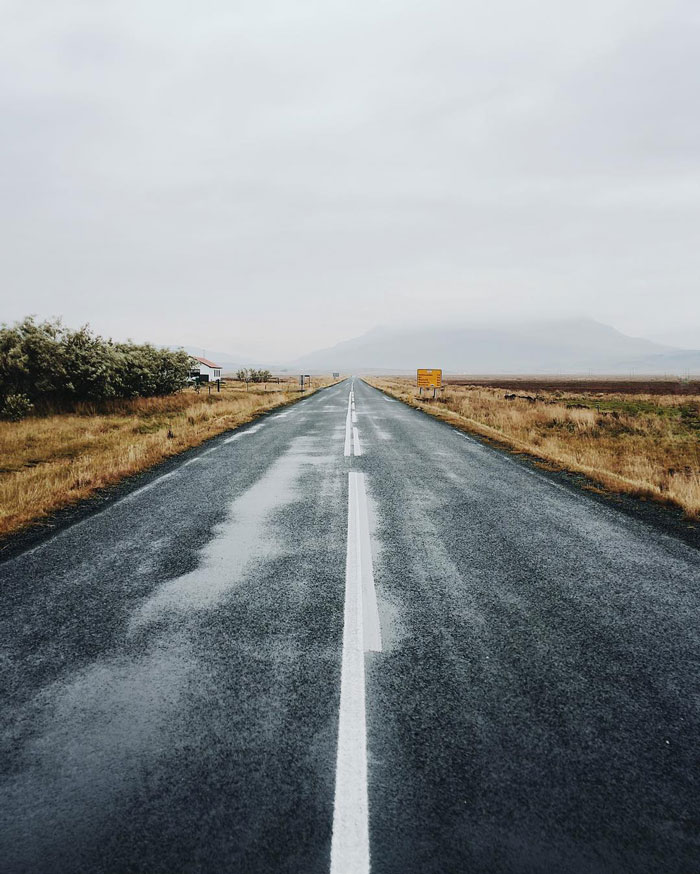
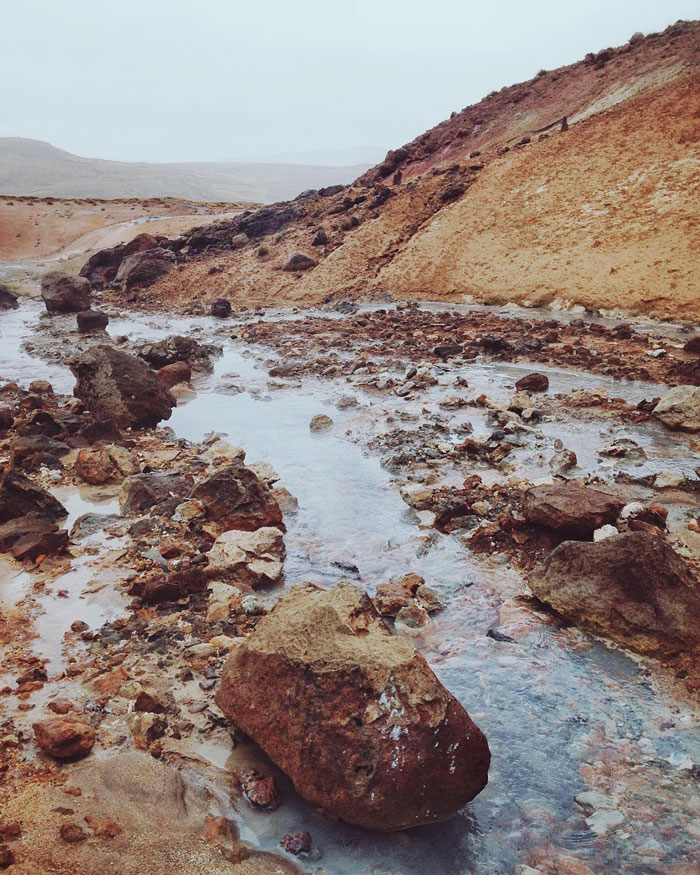
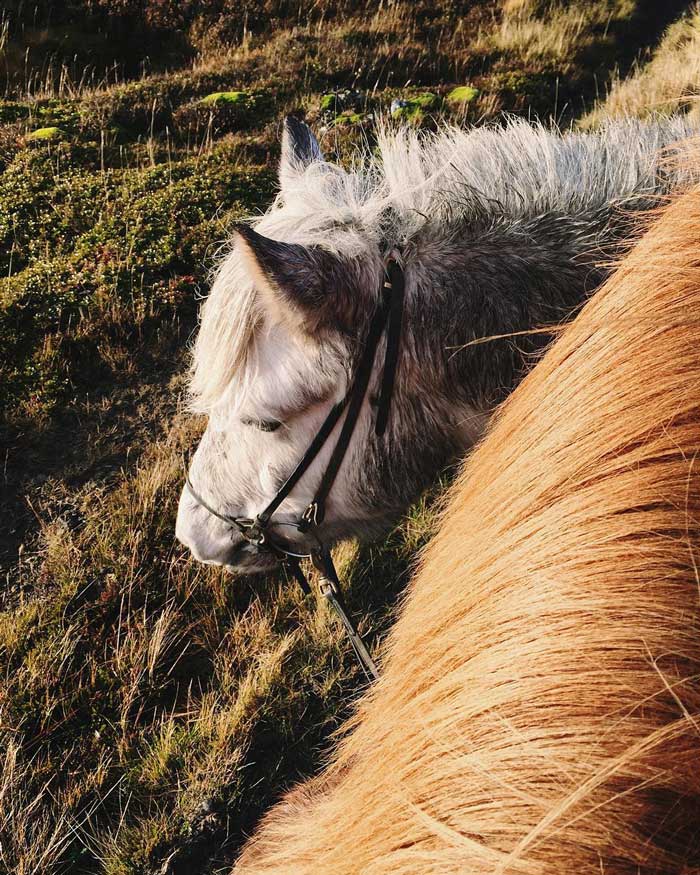
The photography is courtesy of Dan Rubin who has travelled to Iceland and has taken some incredible shots that we used in the demo. Find him on Instagram, Twitter, Flickr and VSCO.
To make this map, we chose canvas for rendering for performance reasons. It could be done purely with SVG, but at the time of writing, SVG rendering performance isn’t quite there yet, while canvas is hardware accelerated on most platforms.
That’s not to say we won’t use SVG at all, though. On the contrary: to draw on the canvas, we need to get the map graphics from somewhere, and maps are perfectly suited for vector formats like SVG. Moreover, we also need to get trail and point data, and SVG is a great candidate to store that information.
So now let’s see how we can use both together.
SVG + Canvas
First, we need to prepare our map. What we will need from it, for this project:
- The trail path;
- The path of the “camera”;
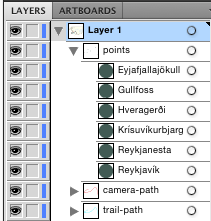
- Points of interest, with names;
- And of course, the map itself.
Both paths are simple… well, <path> elements, that can be drawn with any Bézier curve tool or similar.
<path> elements instead of other primitives such as <polygon>, <line>, etc. If you are using Illustrator, create a Compound Path by selecting the object and going to Edit > Compound Path > Make or by pressing Command/Ctrl+8 to convert the object to <path>Points of interest can be stored using <circle> elements, created with the regular ellipse tool. The names of the points can be set as the name of their layers, and you can retrieve them later with getAttribute('id').
Speaking of layer names, don’t forget to set the name of the layers of these “special” graphics, because we’ll need them in order to access the layers later by code.
Finally, the map itself can be just any graphic. You can draw anything you want on top of it too, like additional points of interest, terrain, parallels, etc.
Drawing SVG on canvas is simple, but comes with a caveat: you can only draw straight from actual .svg files, you can’t modify the SVG with code before drawing. Therefore, you have to hide all the special layers of the SVG (camera path and the like) before saving. Loading the SVG both as a regular <img> for drawing in canvas and as a <svg> element for accessing data means that we have to load it two times and hope the browser cache saves us from having to download it twice.
The code could look like this (using ES2015 and Promises):
  let mapFile='map.svg'
  let mapSVG, mapImage

  ajaxGet(mapFile).then(response=>{ // Load the SVG with an Ajax request.
    mapSVG=Array.from( // Makes a new array from...
      new DOMParser()
        .parseFromString(response,'image/svg+xml')
        .childNodes      // ...the NodeList we get from the parsed SVG file.
      )                       // It returns a handful of nodes, like <!doctype,
      .filter(node=>{         // but we only need the svg element, so we filter that
        let tag=node.tagName  // array looking for any elements ...
        if(typeof tag=='undefined')
          return false
        return tag.toLowerCase()==='svg' // ...that have the tag name svg...
      })[0] // ...and we get the first (and usually only) one.

    loadImage(mapFile).then(img=>{ // Then we load the image again,
      mapImage=img                 // this time as an `img` element.

    ...
The performance gains for using canvas will be nullified, though, if we draw from the SVG on every frame, especially if your map is complex. There are some techniques you can use to avoid that.
The simplest one is creating a hidden canvas and drawing the SVG there once. Then, you draw on the main canvas from that hidden canvas instead of drawing from the SVG: drawing from a bitmap source is much faster.
That might come with some problems though: one of the biggest reasons for using vector graphics is being able to zoom without losing resolution, and that is lost if we draw on a canvas that’s too small. Using a huge canvas for drawing on every frame, though, can get pretty slow.
A technique we can employ to mitigate both issues is keeping a high resolution copy of the map, and using a reasonably sized buffer canvas for moving – and refresh that buffer only when we move or zoom too much.
Doing this allows us to only draw from the high resolution image when we need it, and doesn’t restrict us to using low resolutions.
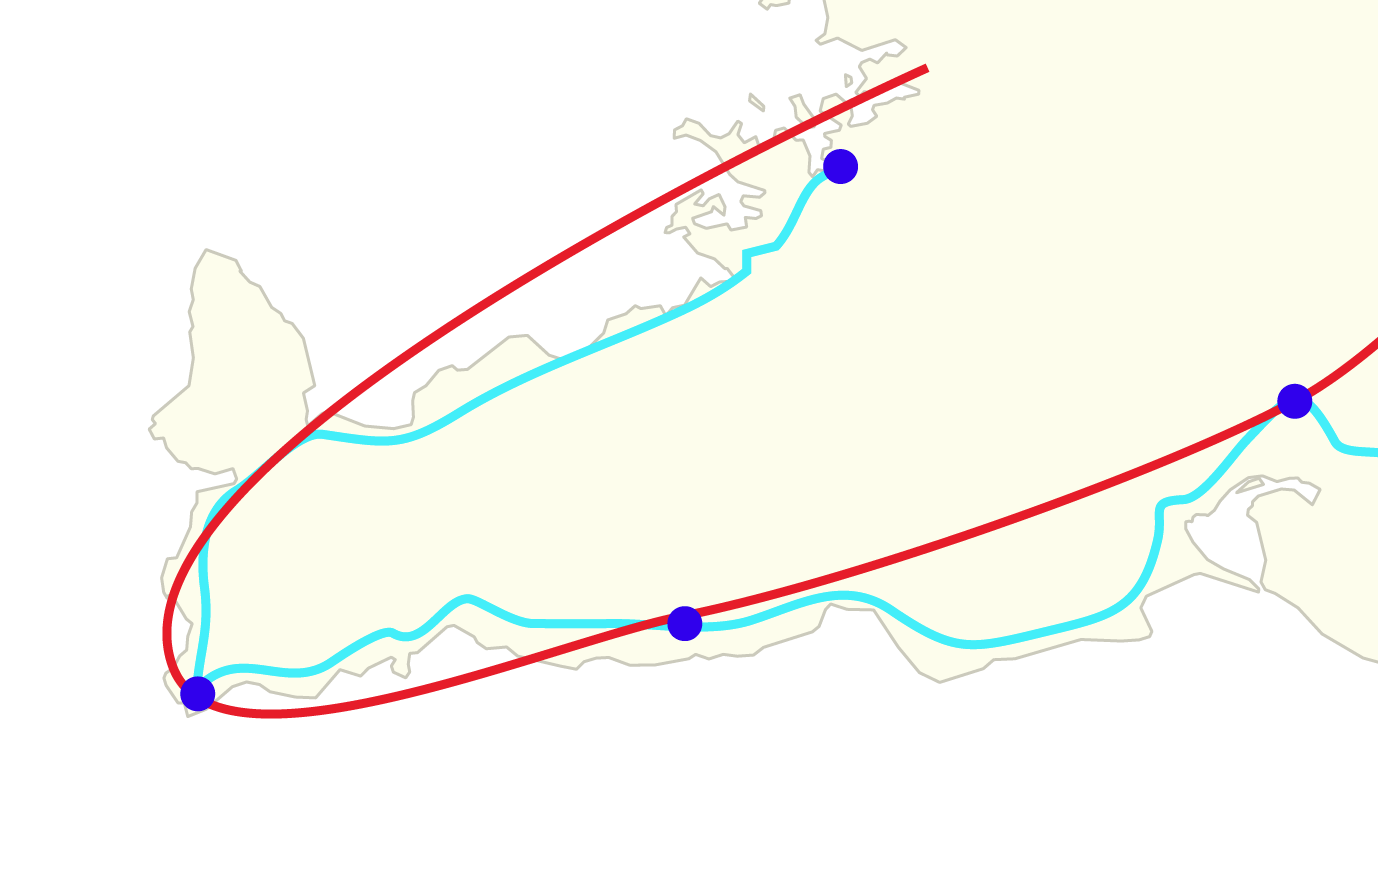
Paths
We can move through an SVG path using a built-in <path> function: getPointAtLength. It returns the position of a point on an arbitrary length along the path. We can get the total length of the path using getTotalLength.
  let path = mapSVG.querySelector('#camera-path path') // Gets the path element
let length = mapSVG.getTotalLength() // Gets the length of the path

// To get, for example, the position of a point halfway through the path
path.getPointAtLength(length*0.5) // returns {x: ..., y: ...}
It would be useful to be able to tell how far along the path each point of interest is located. Unfortunately, there’s no getLengthAtPoint function (of course, because there’s no guarantee that a point crosses the path at all).
We can approximate that, however, getting a length that is more or less close to the point, using simple trigonometry and some iterations:
We can use the same getPointAtLength function to draw the trail on the canvas, running the function a hundred of times, storing the points in an array, and then drawing lines from that array. Alternately, we can parse the d attribute from the <path> element and use similar canvas drawing commands.
Hopefully these techniques will give you a bit of insight into how something like this can be achieved. Now, let’s have a look at the results of our implementation.
The Map in Action
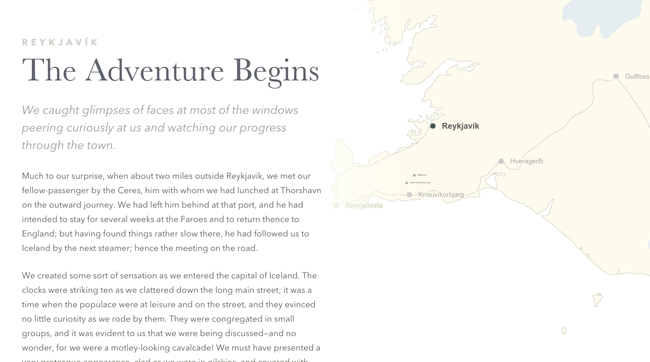
At the beginning of the journey, we show the map and when we start scrolling, the path animation begins.
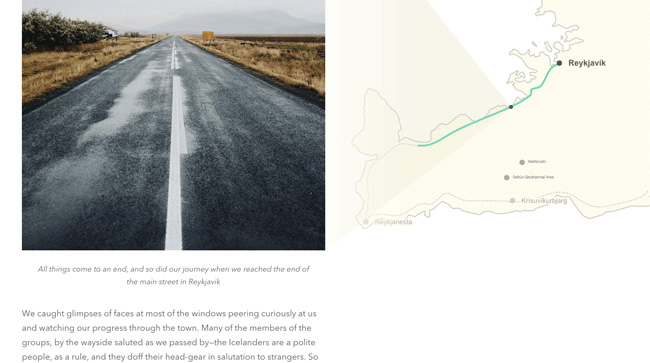
When linking an image in the story with the path, we show a cone that indicates where the picture was taken:
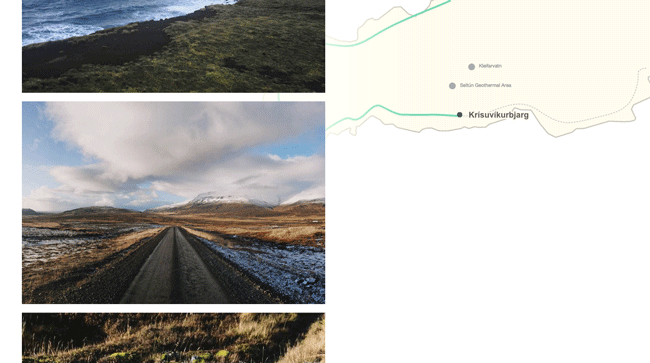
There are points that can be zoomed and paused at, in order to show a gallery or other relevant parts of the story:
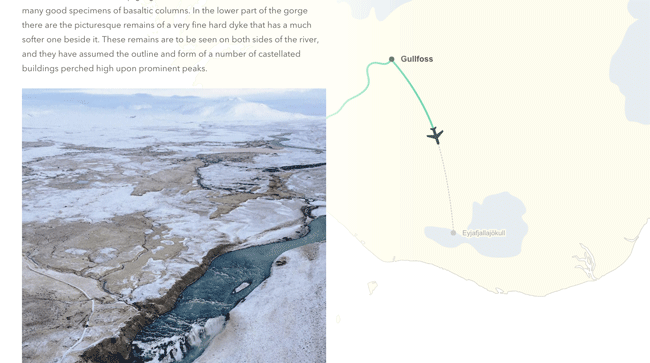
For the final bit, we use a little plane icon to indicate that this part of the journey was taken on an aircraft:
We hope you enjoy this experiment and find it inspiring!
GitHub link coming soon!


Nice tutorial Lucas. Thanks a lot for sharing. 🙂
As someone who’s currently located in Reykjavik, Iceland I was really impressed (and spooked) by the location tracking and dynamic content magic that was going on in this demo. I’m both relieved and disappointed right now 🙂
Great demo nonetheless, Lucas!
Woaaaaaaaa, you’re awesome!
Thanks for a great tutorial.
Amazing! Thanks a lot for the concept. Mobile version is also very well done
Awesome project! I really like the effect you use for linking photo’s to points on the map.
We’ve build an iPhone app called Polarsteps that does a similar thing: it automatically tracks your route and plots it on a map that can be shared with others (through our desktop & mobile site, but as of January we’ll also have following features within the app).
We’re in beta and it’s not as smooth as this template yet (especially because of our additional challenge of plotting every trip automatically without too many human edits). Yet it might be interesting for those who do not have coding skills :). You can download our iPhone app in the app store, or check out an example trip here: .
Curious about your feedback!
Cheers,
Koen
useful, original and very nice indeed. Thank you Lucas!
AWESOME
I’ve wanted to make something like this for ages! Its amazing and beautiful!
I might suggest that a production version would implement some sort of catch-script to complete portions of the animation once a certain scroll-point is passed. Linking it directly to the scroll-position makes some parts feel a bit strange.
But its fantastic, and such a good resource for when I finally do get around to making my own! Thank you for sharing.
This is awesome!!!!
Thanks for sharing this great demo!!
AWESOME!
Spectacular. Amazing work. I’ve always wondered how the New York Times achieves this kind of effect.
Wow.. impresionante me imagino realizar muchas interacciones con estos ejemplos..
Please change the country. Please make any advertising for the whale killers.
Thank you,warm greetings
Albi Deak
#Anonnymous #OpWhales
#Anonymous 🙂
Awesome! Would you consider putting this on GitHub so that we can stay up-to-date with any updates you might do?
Will put on Github soon!
Very, very cool!
Just noted the link to the “Amsterdam to Cape Town by bike” demo in my post above broke for some reason. Here it is again, curious about your feedback! 🙂
https://www.polarsteps.com/niek/615-amsterdam-to-cape-town-by-bike
Looks great, Koen. 🙂 Runs pretty smoothly too!
Bravo! Love this concept 🙂 Keep it up guys! Love your work Lucas
Cool! What an !dea Sir Ji.
Not a big fan of IE (and i am not alone i suppose), but this seems to render properly on edge, 11 and emulated 10. missing something?
It’s weird – it seems to not work for some people. It’s working on the PC I’m using right now though. I have to do some more testing to be sure.
Yeah, it’s working on my IE too (IE 11.20.. on Windows 10).
Funnily enough it is NOT on MS’s Edge (can’t find version nr right away, wacky browser, but probably current latest)
Anyway this project IS amazing!
Big wow. Amazing. Thanks for sharing the demo.
Its amazing way for storytelling a journey.
It supposed can embed video as bachground pr part of the story, focal point image, sound right?
many thanks for sharing
Not only amazing, also very inspiring! I’ve got a little side project that would benefit from such a technique (with some custom adjustments), many thanks for sharing! The photos are also awesome, congrats to the author 🙂
Awesome! It looks and works just amazing 🙂
Hope one day I will visit Iceland as well. There are very nice landscapes.
Beautiful work.
Very Beautiful! Thanks!
Really cool 🙂 Thanks for sharing
Great!!!
Github link?
This is awesome as always 🙂 but mobile is a distraction, maybe split the screen or something similar. Thanks.
You are a God damn wizard
awesome… and it has ‘edge’ support for sure. Great job!
Muito bacana! Gostaria de usar para as minhas viagens! Parabéns!
Awesome !!
Man this is huge ! wow !!!
This is just WOW !!!!!!!!!!!!!!!!!!!!!!!!!!
Nice !
Noob question.. How you install it by ftp?
Really amazing 🙂
Awesome project!
Wow, totally inspirational. Love it
This is just porn =)
Really beautiful idea and execution. Awesome!!
Very nice!
Amazing idea…but not show map when download this project…not in locally not on server…thx in advance bye
Very nice! But, not working map when download locally & server. I appreciate that you said something about it. This!
could u solve that ?? if u do please tell me How ????
I solved that! You have to upload your project on server, the SVG map doesn’t work locally… I don’t know why…
Do you think I could use this technique to scroll a text together with an audio file and make the audio file to move fast forward or backwards together with the text as the user scrolls the page up or down? It would be great for my music project’s web, but as a programmer noob I’m not completely sure about this being possible for me to do or possible at all.
BTW, thanks for sharing this inspirational work.
When I try to integrate it in a PHP page, I recieve the error “Unhandled promise rejection TypeError: e.sections[i] is undefined” do you know what does it mean and how can I resolve it?
you can view it here: http://www.monaco-baviera.net/trip-map/
But r u able to use it? I download and upload on my server and doesnt work…any advice? Thx
Awesome tutorial! I’m going to try porting this to my self-hosted WordPress blog. I’d like to have small pins on the map of where I published blog posts. Hovering over the pins will display a popover over the pin with more info like the location, date, featured image, and post title. Upon clicking on the pin or associated popover, it will scroll the user to that post Do you have any suggestions for how I might accomplish this functionality or something similar? Thanks!
it just work on firefox and dosent work on chrome , edge and etc ..
Can anyone pleaaaaaaaaaaaaaaaaaaaaaase help me to solve this problem plz ??? Lucas what should i do ?
any idea ?
OMG this is great!! Thank you for sharing!